Reporting & Analytics
Maximizer includes powerful reporting and dashboard capabilities to give accurate, detailed, and up-to-date reports and dashboards.
 (1)")

Make Better Decisions
- Derive data-driven insights and make calculated decisions with all your customer information accessible to analytics.
- Align marketing and sales to shorten the sales cycle.
- Improve service delivery.
- Identify up-sell and cross-sell opportunities.
Dashboard Drilldowns
- Get an underlying report of dashboard indicators for further analysis.
- Data is automatically exported to Excel and organized in a separate tab.
- Apply spreadsheet functions and analyze information from multiple new angles.


Take Action
- Respond decisively to what the data says with re-usable action plan templates and dashboard alarms.
- Trigger an alert when an indicator passes a certain mark— and apply automated task lists & reminders to a user,contact, service case or opportunity at a click.
Collaborate around Data & Insights
- Educate your team and circulate insights across your organization with dashboards you can share.
- Click to generate an image of your dashboard view.
- Send it by email right from Maximizer — or embed it in a presentation.

Get richer insights into your data faster with automated reporting and interactive report templates.

Build & Save Reports in minutes
- Shrink your data mountain to a molehill with wide-ranging search criteria and filters built for sales, marketing, service and support.
- Save favorite searches and integrate them into dashboards and reports.
Export Data directly into Spreadsheets or BI tools
- Data directly into Spreadsheets or BI tools Effortlessly shift CRM data into a file format you’re comfortable with.
- Export to multiple formats for reports, quoting, record-keeping and sharing.
- Automatically schedule your favorite reports and dashboards so you’re always up to date on what’s happening (or what’s not) in your business.
")
Manage User Access to Information
- Match user privileges to your business hierarchy.
- Control who can view and edit individual data capture fields.
- Limit access to accounts, contacts, modules, and features.
- Create unlimited security roles and assign them to as many new users as you want.
")
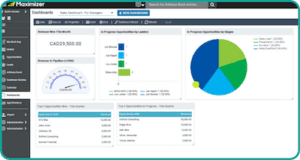
Maximizer’s dashboarding solution provides highlights of your departments through a series of visualizations. View leads and campaign metrics in a single window and get snapshots of your pipeline or outstanding service cases while on the fly.
Build dashboards without any help from IT
- Personalize your display with a user-friendly dashboard wizard.
- Hand-pick indicators, format for their size and appearance, and apply them to saved searches of contacts, opportunities and more.
Accessible from any device
- Equip your team with complete access to customer information wherever they go.
- Manage dashboards from the palm of your hand — along with your calendars and appointments — using Maximizer’s feature-rich mobile app.
Sales Dashboards
See all your important sales indicators in one place.
Verify the progress towards your goals.
Compare won and lost opportunities at a glance.
Quickly identify your top performers according to their
sales success, call frequency and call duration.


Customer Service Dashboards
Get snapshots of your service responsiveness.
Quickly survey ticket resolution times, outstanding cases, and customer success across teams, agents and departments — and optimize your operation for high efficiency.
Marketing Campaign Dashboards
Gain a deeper understanding of your prospects and campaign performance, and improve your segmentation.
Compare email open and conversion rates.
Display customer profiles by industry, geography, revenue and more.


Business Dashboards
Access a single view of your performance across your business.
Choose indicators from marketing analytics, service case reports, sales trends and customer profiles.
Quickly generate graphs and charts to share at meetings.
“With Maximizer, at any given time our managers can just click a button to see the key metrics they need, as opposed to someone manually creating graphs and charts that could take days.”
Communications & Marketing, Roberts Onsite
“We have also dramatically reduced the need to produce or use spreadsheets as all information is now reported on one user-friendly dashboard.”
DEBBIE REID
Office Manager, Miskimmin Taylor